
Page 11 - National Poultry Newspaper
P. 11
Met sources
DL-Met
L-Met Pooled SEM
Met type
DL-Met
L-Met
M+C level (%)
100 90
P value
Met source
Met level
Met source x level
M+C levels (%)
100 90 100 90
BWG (g) FCR
1838 1.63
1827 1.67
1833 1.65
1842 1.68 7.66 0.01
1832 1.65 1837 1.67
1835 1.64 1834 1.68
0.73 0.39
0.95 0.08
0.54 0.79
Carcass Dressing weight (g) (%)
1404 70.18
Breast yield (%)
36.68
35.20
35.74
36.01 0.26
35.94 35.87
35.94 35.87
0.90
0.24
0.09
FI (g)
BW (g)
FCR Liveabil- EPI ity (%)
1.65 98.1 308 1.64 98.2 311
1.65ab 98.5 310 1.64b 98.6 312 1.66a 97.3 305
0.09 0.86 0.26 0.03 0.18 0.09
0.55 0.55 0.44
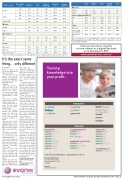
Table 3: Performance parameters of Cobb 500 male broilers fed different Met sources and levels (0-35 d).
Table 4: Performance of Vencobb 400Y broiler chickens fed DL-Met or L-Met at different supplemental levels (0-42 d). a-b Means within a column with no common superscript differ (p<0.05).
Visit our website to view the current edition as a digital flip book or to download a PDF.
www.poultrynews.com.au
It’s the exact same thing... only different
☛ from P10
D-Met to L-Met is not rate limiting (Brachet and Puigserver, 1992).
At requirement or as- ymptote levels (90-100 percent), it is improbable to detect any difference in performance with either of the Met sources.
Trial two
Results of the study re- vealed that none of the performance parameters showed any interac- tion effects between Met sources and levels of Met supplementation (Table 4).
Met sources or supple- mental levels of Met did not affect feed intake.
Similar trends were ob- served for body weight during the entire experi- mental period.
In fact, BW variations between the treatment groups and within the groups were too small to cause any discernible statistical difference in results.
However, levels of Met supplementation had a significant effect on FCR (P<0.05), with 90 percent Met levels showing higher FCR compared to 95 per- cent.
Liveability and produc- tion efficiency were simi- lar across Met source and supplemental levels.
Carcass traits of slaugh- tered birds showed no main or interaction effects for relative organ weights expressed as percentage of live weight.
However, breast and thigh yield percentage showed significant in- teraction between Met source and levels of sup- plemental Met (data not shown).
Breast meat yield was lower by 10 percent when levels of supplemental L- Met were reduced from
100 to 90 percent. However, at highest in-
clusion level of DL-Met, thigh yield was shown to be reduced from 11.2 to 9.5 percent, which seems to be an artefact rather than a dietary treatment effect.
In animal feeding stud- ies, effect of 5-10 percent differences in supplemen- tal Met cannot be shown, as biological variation of birds, feed and analytics will mask and hinder such differentiation.
Tipton et al (1966) quot- ing a review article from Almquist (1965) summa- rised the literature data concerned with the nutri- tional values of the iso- mers reported in the past.
In general, the research- ers who have found the isomers to be essentially equal have used practical type rations containing intact protein as the main source of protein.
Those who have re- ported L-Met to be better utilised than D-Met have used purified diets, were working with unphysi- ological dosage levels or the diet contained large loads of the D-isomers of the AAs.
In conclusion, together with the recent growth performance studies in broilers, the fact that Met isomers are transported and absorbed essentially at the same rate at the intestinal level, coupled with efficient enzymatic conversation of D isomer to L form at the tissue level, validates the claim that DL-Met and L-Met are nutritionally the same.
www.evonik.com/ani mal-nutrition
Pradeep Krishnan and Girish Channarayapa- tna
Evonik Animal Nutri- tion and Care
Turning knowledge into your profit.
www.poultrynews.com.au
National Poultry Newspaper, December 2018/January 2019 – Page 11
1368 1375
1360 12.72
1386 1367
1390 1364
0.48
0.32
0.70
69.58 69.94 69.40 0.25
69.88 69.67
70.06 69.49
0.69
0.27
0.94
DL-Met 3665 2218 L-Met 3667 2229 Levels of supplemental Met (%)
100 3667
NUTRITION
PRODUCTS
SERVICES
COMMUNICATION
Facts & Figures
HANDLING SOLUTIONS
DL-Methionine for AquacultureTM
ANALYTICS
SUSTAINABILITY
www.evonik.com/animal-nutrition animal-nutrition@evonik.com
Evonik Australia Pty Ltd
Suite 33, 1 Ricketts Road Mount Waverley, VIC 3149
Australia
Amy Liu
amy.liu@evonik.com
Met source
95 3652 90 3678 P value
Met source
2224 2225 2221
0.31 0.95
0.92
Levels of sup- plemental Met
Met source x level
0.88 0.34
0.96
