
Page 14 - National Poultry Newspaper
P. 14
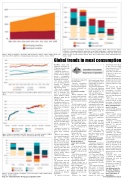
Figure 2: Per person consumption of meat, selected countries, 2018f. OECD forecast. Notes: Per person consumption data are expressed on an edible weight basis, estimated using OECD conversion factors of 0.7 for beef and veal; 0.78 for pig meat; 0.88 for poultry and sheep meat;
Figure 1: Meat consumption, developing and developed countries, 1998 to 2018f. OECD fore- and 0.6 for fish. Poultry includes chicken, duck, goose, guinea fowl, turkey and prepared liver. cast. Note: OECD definitions of developing and developed countries. Source: OECD. Source: OECD.
Figure 3: Per person consumption of meat, 1998 to 2018f. OECD forecast. Source: OECD.
Figure 4: Meat consumption and GDP per person, selected countries, 1990 to 2018f. OECD forecast. Sources: OECD; International Monetary Fund.
Figure 5: Changes in meat consumption, selected countries, 1998 to 2018f. OECD forecast. Source: OECD.
Page 14 – National Poultry Newspaper, September 2019
GLOBAL meat con- sumption increased by 58 percent over the past 20 years to 2018.
Population growth ac- counted for 54 percent of this increase and per person consumption growth accounted for the remaining four percent.
Per person consump- tion was influenced most strongly by changing consumer preferences and income growth.
This article compares trends in meat consump- tion in Australia and some of its major meat export markets—China, Indonesia, Japan and the United States.
In the 20 years to 2018 developing countries ac- counted for around 85 percent of the rise in global meat consumption (Figure 1).
Between 1998 and 2018, Chinese consumption in- creased by 72 percent.
This increase account- ed for 34 percent of glob- al consumption growth.
Population growth has been the principal driver behind increased Chi- nese consumption of all meats.
Indonesia accounts for only three percent of global meat consump- tion.
However, the combina- tion of population growth and strong economic growth between 1998 and 2008 resulted in In- donesian meat consump- tion more than doubling.
Strong Chinese de- mand growth and land constraints on meat pro- duction in Indonesia in- creased global import demand for meat.
These two countries are now major importers of meat.
In Australia and the United States, meat con- sumption increased over the 20 years to 2018 be- cause of higher poultry consumption.
This demand is met principally by domestic production.
In contrast, total meat
consumption in Japan fell over the period.
Japanese expenditure on meat has fallen be- cause the ageing popula- tion has weakened over- all demand.
Per person consump- tion
When compared with its major export partners, Australia’s meat con- sumption closely matches the United States (Figure 2).
In both countries’ poul- try is the most consumed meat at over 40 kg per person.
Beef and veal and pig meat each account for be- tween 20 and 30 kg per person.
Fish accounts for around 15 kg per person and sheep meat for less than 10 kg per person.
In Japan and Indone- sia, fish is the dominant source of protein by a large margin.
In China, pig meat is the most consumed meat, followed by fish.
Beef, veal and sheep meat form a relatively small share of consump- tion in all Asian markets. Rising incomes in- crease meat consump- tion
Over the past 20 years, per person meat con- sumption has grown strongly in Indonesia and China.
Growth has been much slower in Australia and the United States.
In contrast, meat con- sumption fell in Japan.
Rising incomes are a major driver of increased meat consumption.
Between 1990 and 2018 higher real GDP per person coincided with higher rates of meat con- sumption.
However, the impact
that rising income has on meat consumption slows considerably as countries develop (Figure 4).
Per person consumption in China and Indonesia increased markedly with small increases in in- come over the period.
In contrast, Australian and US meat consump- tion was much less sensi- tive to income growth.
Japan is an exception to the correlation between consumption and income.
Per person meat con- sumption in Japan has fallen considerably since 1990 despite rising in- comes.
This reflects an ageing population that is reduc- ing overall expenditure on food.
Lower fish consump- tion accounts for most of the decline, reflecting changing consumer pref- erences towards a more western diet.
Other than fish, Japa- nese consumption of meat has risen at a rate similar to other devel- oped countries.
White meat increasing per person consump- tion growth
Consumer preferences globally have shifted to- wards higher consump- tion of fish and poultry, which now account for a much larger share of meat consumption.
In China and Indone- sia, a rapid rise in fish consumption has been driven by strong growth in domestic fish produc- tion compared with other meats.
Fish remains the domi- nant source of protein in Indonesia, accounting for around two–thirds of meat consumption.
In China, pig meat remains the most con-
sumed meat, but its share of the total has fallen from 48 percent in 1998 to 40 percent in 2018.
Fish now accounts for 34 percent of meat con- sumed in China.
In developed countries, growth in total meat con- sumption has been slower because it has been com- paratively high for a long time.
In Australia and the United States, higher consumption of poultry has more than offset re- duced consumption of beef, veal and sheep meat (Figure 5).
This trend has been primarily driven by the increasing affordability of poultry over red meat. Meat consumption pro- jected to increase
Between 2019 and 2024 meat consumption is ex- pected to rise.
This is largely driven by population growth and rising incomes in de- veloping countries.
Ongoing economic growth in Indonesia is expected to increase meat consumption.
Population and income growth will drive higher consumption in China.
However, per person consumption growth will slow as consumption ap- proaches that of devel- oped countries.
Consumption growth in Australia and the United States is expected to be minimal and moderate increases in poultry meat will be mostly offset by declines in beef, veal and sheep meat.
Globally, white meat is expected to continue displacing red meat in consumer diets.
However, this ongoing adjustment is assumed to be lower than over the decade to 2018.
Tim Whitnall and Na- than Pitts. Published on Australian Govern- ment Department of Agriculture.
Global trends in meat consumption
www.poultrynews.com.au
